


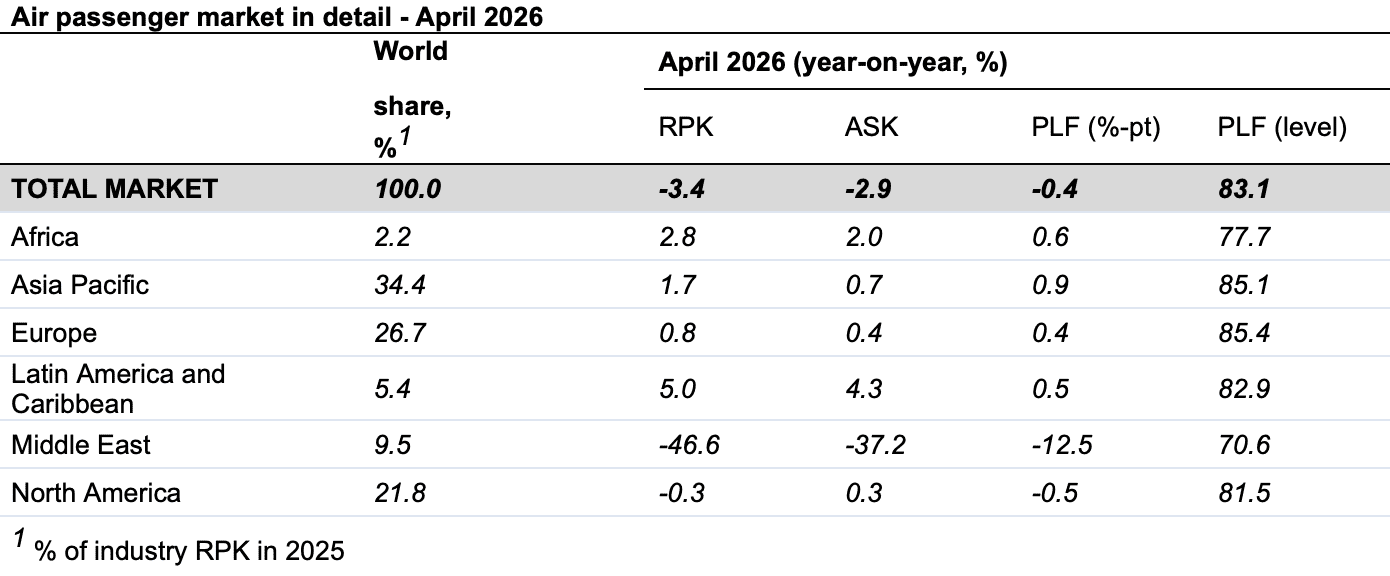
SINGAPORE, 1 June 2026: Total demand, measured in revenue passenger kilometres (RPK), was down 3.4% compared to April 2025 due to the dramatic decline in passenger demand in the Middle East, according to data released by the International Air Transport Association (IATA) for April 2026.
Excluding the Middle East, demand increased by 1.2%. Total capacity, measured in available seat kilometres (ASK), decreased by 2.9% year-on-year. The load factor was 83.1% (-0.4 ppt compared to April 2025).
International demand fell 5.3% compared to April 2025. Excluding the Middle East, demand grew by 1.9%. Capacity was down 5.1% year-on-year, and the load factor was 83.9% (-0.2 ppt compared to April 2025).
Domestic demand was flat compared to April 2025. Capacity increased 0.8% year-on-year. The load factor was 81.9% (-0.7 ppt compared to April 2025).
“The 46.6% fall in demand for carriers in the Middle East due to war in the region was so acute that it dragged overall demand down 3.4%. The situation for air transport remains highly volatile. The cost of jet fuel more than doubled in April, which is pushing airfares up. Forward schedule data is showing a reduced offering in the coming months, indicating that airlines are balancing high fuel costs and weaker demand,” said IATA’s Director General Willie Walsh.
Regional Breakdown – International Passenger Markets
International RPK fell -5.3%, with capacity falling -5.1%. However, this decline was caused by continuing heavy falls in demand for Middle East carriers. Excluding the Middle East, RPK increased by 1.9%. North America was flat, and all other regions reported growth.
Asia-Pacific airlines achieved a 3.0% year-on-year increase in demand. Capacity increased 0.7% year-on-year, and the load factor was 87.5% (+1.9 ppt compared to April 2025), a record high for April. There was a notable slowdown in traffic on the Japan-China corridor due to ongoing political tensions.
European carriers saw a 0.9% year-on-year increase in demand. Capacity increased 0.3% year-on-year, and the load factor was 84.9% (+0.6 ppt compared to April 2025). Direct traffic between Europe and Asia increased 15.3% as it replaced traffic transiting through the Middle East.
North American carriers saw a 0.0% year-on-year increase in demand. Capacity decreased 1.1% year-on-year, and the load factor was 83.9% (+0.9 ppt compared to April 2025).
Middle Eastern carriers saw a -48.1% year-on-year decrease in demand. Capacity fell 38.4% year-on-year, and the load factor was 70.1% (-13.1 ppt compared to April 2025). Traffic was affected by the ongoing war in Iran, though the decline slowed slightly compared to March as an uneasy ceasefire came into effect.
Latin American airlines achieved an 8.9% year-on-year increase in demand. Capacity climbed 7.2% year-on-year. The load factor was 84.6% (+1.4 ppt compared to April 2025).
African airlines saw a 2.2% year-on-year increase in demand. Capacity was up 1.2% year-on-year. The load factor was 77.9% (+0.7 ppt compared to April 2025).
(Source: IATA)


