

BANGKOK, 17 May 2019: Asia Pacific destinations collectively received almost 700 million international visitor arrivals (IVAs) in 2018, an increase of 7.7% over the 2017 figure, according to PATA’s Annual Tourism Monitor 2019 Early Edition released Thursday.
Rising from an arrivals volume of just almost 562 million in 2014, the annual growth of visitors into and across the Asia Pacific region has increased consistently each year, peaking in 2018 at 699.6 million international arrivals.
The distribution of these arrivals has been relatively constant over the past five years, although marginally favouring Asia, largely at the expense of the Americas.
Within each of those destination regions, there are differences across both individual destinations and at the sub-regional level. Between 2014 and 2018 for example, Southeast Asia gained 1.34 points of share in terms of IVAs into and across the Asia Pacific region, while North America lost 1.55 points of share.
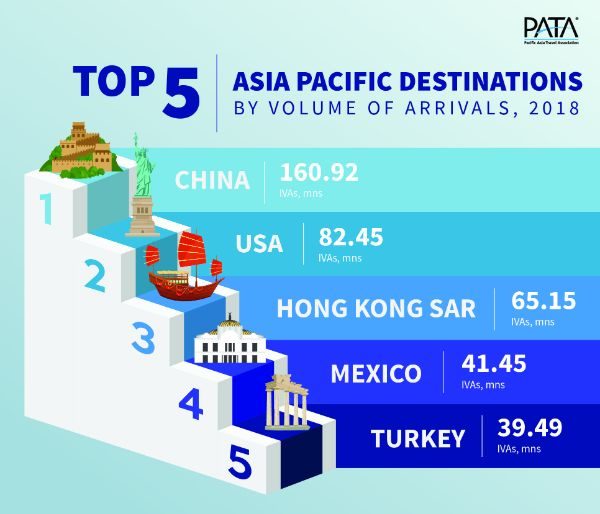
There are several main indicators of particular interest at this level, particularly the top five destinations by volume of visitor arrivals in 2018. Clearly, China was the number one destination for visitor arrivals, with close to 161 million in 2018. That alone represents 22.6% of the total visitor volume into and across the region in that year.
The remaining four destinations in this top five list cover North and Central America as well as Northeast and West Asia. Collectively, these top five destinations accounted for 54.8% of the total visitor arrivals into and across the region in 2018.
A second destination indicator considers the top five destinations that received the most additional volume added to their respective inbound counts between 2017 and 2018.
This particular list is remarkably similar to the previous one, except that Mexico has been replaced by Macao, China. In total, 12 destinations of the 47 covered in this report had annual increases in excess of one million IVAs apiece between 2017 and 2018.
This top five group received a total of over 30 million additional arrivals between 2017 and 2018, which was just over 59% of the total net arrivals for the Asia Pacific region over this period.
A third indicator looks at the longer-term growth of destinations, in particular, the top five destinations that showed the strongest percentage growth in arrivals between 2017 and 2018.
Over the longer term – between 2014 and 2018 – it is interesting to see the top five destinations that received the most additional IVA volume added to their inbound counts over that period. China tops the list with over 34.2 million additional arrivals added to its inbound count, followed by Japan with a gain of close to 17.8 million IVAs over that period and then Thailand with almost 13.5 million additional IVAs.
Mexico and Vietnam close out that top five list with period increases of 12.1 million IVAs and more than 7.6 million.
In addition, and based on these top five AAGR results, Indonesia is certainly a destination to keep watching.
PATA’s Annual Tourism Monitor 2019 Early Edition is now available on the PATA Store.


