


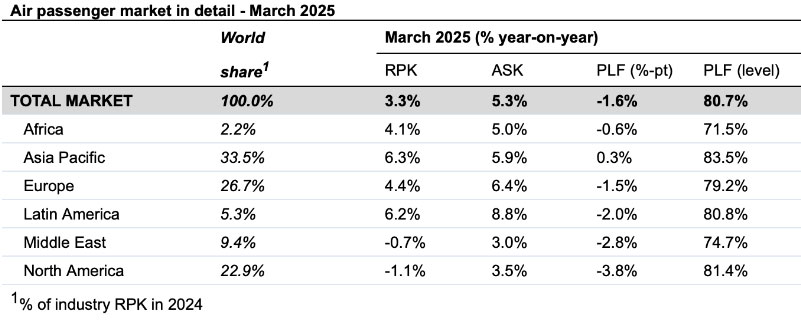
SINGAPORE, 7 MAY 2025: Passenger demand, measured in revenue passenger kilometres (RPK) during March 2025, improved by 3.3% compared to March 2024, according to the latest data from the International Air Transport Association (IATA) released last week.
IATA’s air traffic highlights for March 2025 also showed capacity, measured in available seat kilometres (ASK), was up 5.3% year-on-year.
The March load factor was 80.7% (-1.6 ppt compared to March 2024).
International demand rose 4.9% compared to March 2024. Capacity was up 7.0% year-on-year, and the load factor was 79.9% (-1.7 ppt compared to March 2024).
Domestic demand increased 0.9% compared to March 2024. Capacity was up 2.5% year-on-year. The load factor was 82.0% (-1.3 ppt compared to March 2024).
“Passenger demand grew by 3.3% year-on-year in March, a slight strengthening from the 2.7% growth reported for February. However, a capacity expansion of 5.3% outpaced the demand expansion, leading to a load factor decline from record highs to 80.7% systemwide. There remains a lot of speculation around the potential impacts of tariffs and other economic headwinds on travel. While the small decline in demand in North America needs to be watched carefully, March numbers continued to show a global growth pattern for air travel. That means the challenges associated with accommodating more people who need to travel—specifically alleviating supply chain problems and ensuring sufficient airport and air traffic management capacity — remain urgent,” said IATA’s Director General Willie Walsh.
Regional Breakdown – International Passenger Markets
International RPK growth slowed to 4.9% in March year-on-year, from the 5.9% reported for February and the 12.5% reported in January. This slowdown since January largely reflects the final normalisation of year-on-year demand comparisons post-COVID. Asia-Pacific was the strongest performer among regions, with 9.9% growth. Load factors fell in every region, for a -1.7 ppt overall decline.
Asia-Pacific airlines reported a 9.9% year-on-year increase in demand. Capacity increased 11.6% year-on-year, and the load factor was 84.1% (-1.3 ppt compared to March 2024).
European carriers had a 4.9% year-on-year increase in demand. Capacity increased 6.9% year-on-year, and the load factor was 78.2% (-1.5 ppt compared to March 2024).
Middle Eastern carriers saw a -1.0% year-on-year decline in demand. Capacity increased 2.8% year-on-year, and the load factor was 74.6% (-2.9 ppt compared to March 2024). The decrease in demand is likely related to the timing of Ramadan, which impacts travel patterns.
North American carriers saw a 0.1% year-on-year fall in demand. Capacity increased 2.0% year-on-year, and the load factor was 83.0% (-1.8 ppt compared to March 2024). While demand had a second consecutive month of year-on-year contraction, it is important to note that this is an improvement on the -1.5% decline reported for February.
Latin American airlines saw a 7.7% year-on-year increase in demand. Capacity climbed 12.1% year-on-year. The load factor was 80.9% (-3.3 ppt compared to March 2024).
African airlines saw a 3.3% year-on-year increase in demand. Capacity was up 3.5% year-on-year. The load factor was 70.1% (-0.2 ppt compared to March 2024).


