


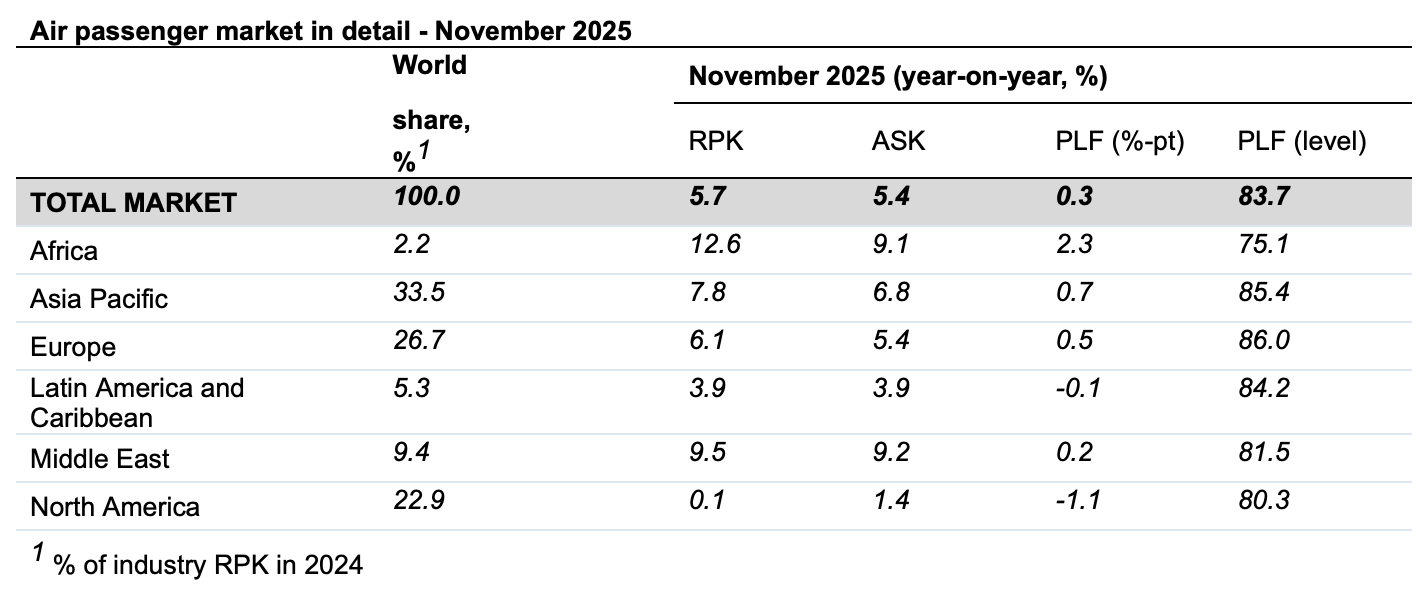
SINGAPORE, 13 January 2026: Global passenger traffic for November 2025 showed demand, measured in revenue passenger kilometres (RPK), increased 5.7% compared to November 2024, according to the International Air Transport Association’s latest air traffic data released this week.
Total capacity, measured in available seat kilometres (ASK), increased 5.4% year-on-year.

The load factor was 83.7% (+0.3 ppt compared to November 2024), a record high for November.
International demand rose 7.7% compared to November 2024. Capacity was up 7.1% year-on-year, and the load factor was 84.0% (+0.4 ppt compared to November 2024).
Domestic demand increased 2.7% compared to November 2024.
Capacity was up 2.7% year-on-year. The load factor was 83.2% (unchanged compared to November 2024).
“November 2025 saw continued strong demand for air travel with year-on-year growth of 5.7%. Load factors reached a new record of 83.7% for the month as airlines continued to satisfy growing passenger demand amid continuing capacity constraints stemming from challenges in the aerospace supply chain.
“The new year’s resolution for the manufacturing sector must be to increase production to meet the needs of its airline customers. The backlog of more than 17,000 aircraft orders that we reached in 2025 must be reduced in 2026,” said IATA’s Director General Willie Walsh.
Regional Breakdown – International Passenger Markets
International RPK growth was a healthy 7.7% year over year in November. The international load factor, at 84.0%, was also a November record high. Compared to October, growth was slightly down in all regions except Africa.
Asia-Pacific airlines achieved a 9.3% year-on-year increase in demand. Capacity increased 8.7% year-on-year, and the load factor was 85.8% (+0.5 ppt compared to November 2024). Geopolitical tensions led to traffic between China and Japan slowing to single-digit growth in 2025 for the first time.
European carriers had a 6.8% year-on-year increase in demand. Capacity increased 6.1% year-on-year, and the load factor was 85.6% (+0.5 ppt compared to November 2024).
North American carriers saw a 4.0% year-on-year increase in demand. Capacity increased 4.2% year-on-year, and the load factor was 81.0% (-0.1 ppt compared to November 2024). Looking at total traffic, North America has seen 10 consecutive months of year-on-year decline in load factor.
Middle Eastern carriers saw a 9.6% year-on-year increase in demand. Capacity increased 9.2% year-on-year, and the load factor was 81.4% (+0.3 ppt compared to November 2024).
Latin American airlines saw a 4.4% year-on-year increase in demand. Capacity climbed 4.7% year-on-year. The load factor was 83.9% (-0.2 ppt compared to November 2024).
African airlines were the standout performers, with a 11.2% year-on-year increase in demand. Capacity was up 8.5% year-on-year. The load factor was 74.3% (+1.8 ppt compared to November 2024).
(Source: IATA)


