


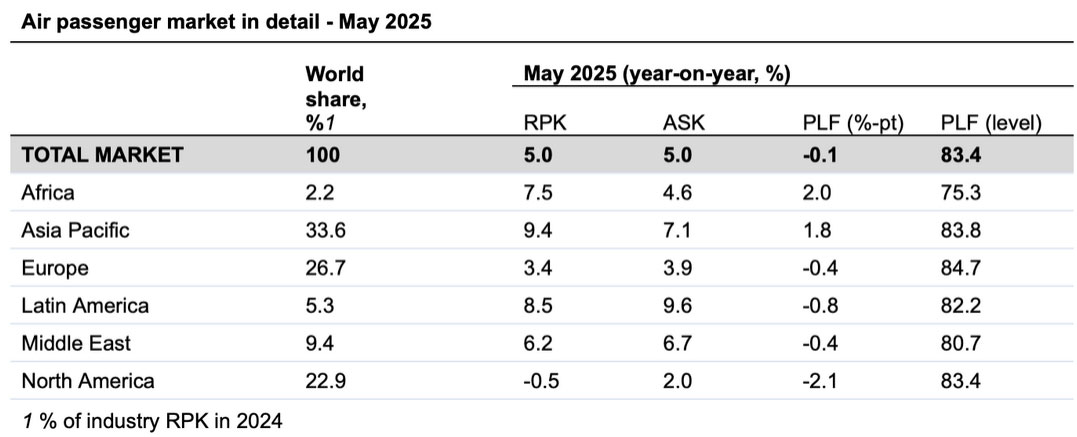
SINGAPORE, 2 July 2025: Total demand measured in revenue passenger kilometres (RPK), improved by 5% in May, compared with May 2024, reports the International Air Transport Association in its latest data released on Monday
IATA’s data for May also showed total capacity, measured in available seat kilometres (ASK), was up 5% year-on-year. The May load factor was 83.4% (-0.1 ppt compared to May 2024).
International demand rose 6.7% compared to May 2024. Capacity was up 6.4% year-on-year, and the load factor was 83.2% (+0.2 ppt compared to May 2024). This is a record load factor on international flights for May.
Domestic demand increased 2.1% compared to May 2024. Capacity was up 2.8% year-on-year. The load factor was 83.7% (-0.5 ppt compared to May 2024).
“Air travel demand growth was uneven in May. Globally, the industry reported a 5% growth, with the Asia-Pacific region leading the way at 9.4%. The outlier was North America, which reported a 0.5% decline, led by a 1.7% fall in the US domestic market. Severe disruptions in the Middle East in late June remind us that geopolitical instability remains a challenge in some regions, as airlines maintain safe operations with minimal passenger inconvenience.
“The impact of such instability on oil prices — which remained low throughout May — is also a critical factor to monitor. Importantly, consumer confidence appears to be strong with forward bookings for the peak Northern summer travel season, giving good reason for optimism,” said IATA’s Director General Willie Walsh.
Regional Breakdown – International Passenger Markets
International RPK growth reached 6.7% in May year-on-year, with growth in all regions but a mixed picture on load factors, which increased only by 0.2 ppt. Traffic expansion on most key international routes to the Americas slowed in May, except for the Transatlantic route, which saw a modest 2.5% year-over-year increase.
Asia-Pacific airlines achieved a 13.3% year-on-year increase in demand. Capacity increased 10.6% year-on-year, and the load factor was 84.0% (+2.0 ppt compared to May 2024).
European carriers had a 4.1% year-on-year increase in demand. Capacity increased 4.8% year-on-year, and the load factor was 84.0% (-0.6 ppt compared to May 2024).
North American carriers saw a 1.4% year-on-year increase in demand. Capacity increased 1.7% year-on-year, and the load factor was 83.8% (-0.3 ppt compared to May 2024).
Middle Eastern carriers saw a 6.2% year-on-year increase in demand. Capacity increased 6.3% year-on-year, and the load factor was 80.9% (-0.1 ppt compared to May 2024).
Latin American airlines saw an 8.8% year-on-year increase in demand. Capacity climbed 11.0% year-on-year. The load factor was 83.6% (-1.7 ppt compared to May 2024).
African airlines saw a 9.5% year-on-year increase in demand. Capacity was up 6.2% year-on-year. The load factor was 74.9% (+2.2 ppt compared to May 2024). Africa-Asia is the fastest-growing international corridor, with a 15.9% expansion.
See complete passenger market analysis:


