


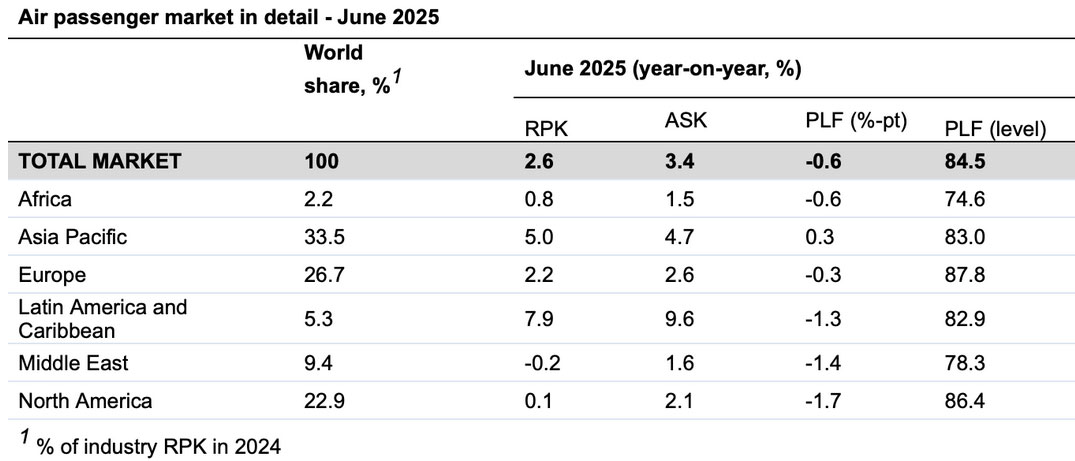
SINGAPORE, 4 August 2025: The International Air Transport Association (IATA) released data for June 2025 showing global passenger demand measured in revenue passenger kilometres (RPK), improving 2.6% compared to June 2024 but at a slower pace than registered in previous months.
Total capacity, measured in available seat kilometres (ASK), was also up 3.4% year-on-year. The June load factor was 84.5% (-0.6 ppt compared to June 2024).
International demand rose 3.2% compared to June 2024. Capacity was up 4.2% year-on-year, and the load factor was 84.4% (-0.8 ppt compared to June 2024).
Domestic demand increased 1.6% compared to June 2024. Capacity was up 2.1% year-on-year. The load factor was 84.7% (-0.4 ppt compared to June 2024).
IATA’s Director General Willie Walsh commented: “Demand for air travel grew by 2.6% in June. That’s a slower pace than we have seen in previous months and reflects disruptions around military conflict in the Middle East. With demand growth lagging the 3.4% capacity expansion, load factors dipped 0.6 percentage points from their all-time record-high levels. At 84.5% globally, however, load factors are still powerful. And with a modest 1.8% capacity growth visible in August schedules, load factors over the northern summer are unlikely to stray far from their recent historic highs”.
Regional Breakdown – International Passenger Markets
International RPK growth reached 3.2% in June year-on-year, but load factor fell across all regions as capacity growth outstripped demand. The steepest fall in RPK growth from May was in the Middle East, where international traffic contracted 0.4% year-on-year, impacted by military conflict.
Asia-Pacific airlines achieved a 7.2% year-on-year increase in demand. Capacity increased 7.5% year-on-year, and the load factor was 82.9% (-0.2 ppt compared to June 2024).
European carriers had a 2.8% year-on-year increase in demand. Capacity increased 3.3% year-on-year, and the load factor was 87.4% (-0.4 ppt compared to June 2024).
North American carriers saw a 0.3% year-on-year fall in demand. Capacity increased 2.2% year-on-year, and the load factor was 86.9% (-2.2 ppt compared to June 2024).
Middle Eastern carriers saw a 0.4% year-on-year decrease in demand. Capacity increased 1.1% year-on-year, and the load factor was 78.7% (-1.2 ppt compared to June 2024). Military conflict particularly impacted traffic on routes to North America (-7.0% year-on-year) and Europe (-4.4% year-on-year).
Latin American airlines saw a 9.3% year-on-year increase in demand. Capacity climbed 11.8% year-on-year. The load factor was 83.3% (-1.9 ppt compared to June 2024).
African airlines saw a 0.3% year-on-year decrease in demand. Capacity was up 0.3% year-on-year. The load factor was 74.6% (-0.5 ppt compared to June 2024). The decline in African load factor may be due to increased competition from European and Middle Eastern carriers.


