


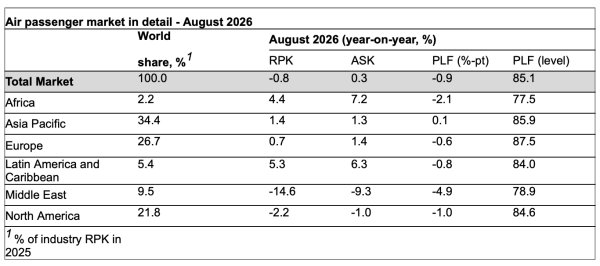
SINGAPORE, 2 October 2026: Total passenger demand, measured in revenue passenger kilometres (RPK), fell 0.8% from August 2025, according to the International Air Transport Association’s latest August 2026 data.
However, when excluding the Middle East, demand grew by 0.6%. Total capacity, measured in available seat kilometres (ASK), increased 0.3% year-on-year. The load factor was 85.1% (-0.9 ppt compared to August 2025).
International demand fell 0.9% compared to August 2025. Excluding the Middle East, demand grew by 1.3%. Capacity was flat (0.0%) year on year, and the load factor was 85.0% (-0.8 ppt compared to August 2025).
Domestic demand fell 0.5% compared to August 2025. Capacity increased 0.7% year-on-year. The load factor was 85.3% (-1.1 ppt during the same reference period).
“Global demand for air transport contracted by 0.8% compared to August 2025 as the recovery trajectory for carriers in the Middle East was interrupted. The region’s carriers reported that demand was 14.6% lower year-on-year, reversing an improving trend.
Excluding the Middle East carriers, demand for air travel grew by 0.6% year-on-year in August, half the pace seen in July. With some important exceptions such as domestic China, global connectivity was generally weaker in August. The coming months will reveal whether travellers, whose purchasing power has been reduced by higher energy prices, are adjusting their travel budgets and whether prevailing geopolitical instability is discouraging them from travelling. In the meantime, forward schedules for October are showing cautious optimism with 2% growth in available seats,” said IATA’s Senior Vice President Sustainability and Chief Economist Marie Owens Thomsen.
Regional Breakdown – International Passenger Markets
International RPK fell 0.9% year on year, with capacity unchanged. However, excluding the Middle East carriers, total demand rose 1.3% on the same basis.
Asia-Pacific airlines saw demand fall 0.1% year on year. Capacity fell 0.9% year on year, and the load factor was 85.6% (+0.7 ppt compared to August 2025). Traffic on routes within Asia fell 2.0%, and capacity declined for the fourth straight month. By contrast, traffic on the Asia-North America corridor grew by 2.5%.
European carriers saw a 2.1% year-on-year increase in demand. Capacity rose 2.8% year-on-year, and the load factor was 86.8% (-0.6 ppt compared to August 2025). The Europe-Asia corridor continued to expand strongly (+12.2%), but transatlantic routes fell 2.4%, with traffic declining from several markets, including the UK and France.
North American carriers saw demand fall 1.7% year on year. Capacity fell 1.1% year on year, and the load factor was 86.8% (-0.5 ppt compared to August 2025).
Middle Eastern carriers saw a 14.2% year-on-year decrease in demand. Capacity fell 9.0% year-on-year, and the load factor was 79.1% (-4.8 ppt compared to August 2025). Traffic declined further in August, reversing the gradual stabilisation trend since the Iran war in February. The year-on-year contraction on Middle East-Asia routes, for example, accelerated to -11.7% from -8.6% in July.
Latin American airlines achieved a 6.7% year-on-year increase in demand. Capacity climbed 6.4% year-on-year. The load factor was 84.8% (+0.2 ppt compared to August 2025).
African airlines saw demand rise 6.7% year on year. Capacity was up 8.3% year-on-year. The load factor was 78.4% (-1.2 ppt compared to August 2025).
(Source: IATA)