


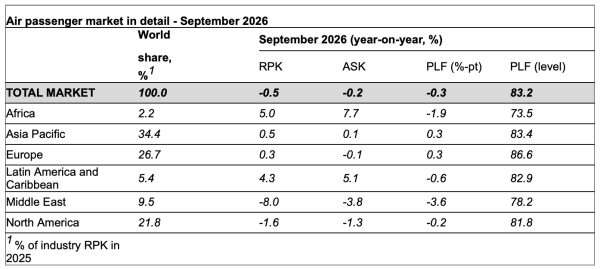
SINGAPORE, 2 November 2026: The International Air Transport Association (IATA) released data for September 2026 global passenger demand: Total demand, measured in revenue passenger kilometres (RPK), fell 0.5% from September 2025.
Excluding the Middle East, demand grew by 0.3%. Total capacity, measured in available seat kilometres (ASK), decreased 0.2% year-on-year. The load factor was 83.2% (-0.3 ppt compared to September 2025).
International demand grew 0.4% compared to September 2025. Excluding the Middle East, demand grew by 1.7%. Capacity was up 0.5% year-on-year, and the load factor was 83.6% (-0.1 ppt compared to September 2025).
Domestic demand fell 2.2% compared to September 2025. Capacity decreased 1.3% year-on-year. The load factor was 82.5% (-0.7 ppt during the same reference period).
“Air traffic demand fell 0.5% in September, reflecting weaknesses in the Middle East and North America. Nevertheless, this improved from August, with a welcome return to growth in most international markets. These patterns have repeated themselves throughout much of the year, and we can expect them to continue amid geopolitical uncertainty and volatile fuel prices. Global scheduled seat capacity is expected to remain above 2025 levels in October and November, but the rates of growth remain weak and highly unbalanced between regions,” said IATA’s Senior Vice President Sustainability and Chief Economist Marie Owens Thomsen.
Regional Breakdown – International Passenger Markets
International RPK grew 0.4%, with capacity up 0.5%. Most key routes improved over August, with some returning to growth and others seeing a slower rate of decline.
Asia-Pacific airlines saw a 0.7% year-on-year increase in demand. Capacity increased 0.4% year-on-year, and the load factor was 83.1% (+0.3 ppt compared to September 2025). Traffic increased on four of the six largest international route areas serving Asia-Pacific. On routes within Asia, traffic declined by 0.9%, though at a slower rate than in August.
European carriers saw a 1.8% year-on-year increase in demand. Capacity rose 1.2% year-on-year, and the load factor was 86.1% (+0.5 ppt compared to September 2025). Traffic on the transatlantic corridor declined by 0.6%, improving from a 2.5% contraction in August.
North American carriers saw flat demand of 0.0% year-on-year. Capacity fell 1.9% year-on-year, and the load factor was 84.9% (+1.6 ppt vs September 2025). Traffic declined on three of the four largest international route areas serving North America, although the decreases were less severe than in August.
Middle Eastern carriers saw a 7.5% year-on-year decrease in demand. Capacity fell 3.3% year-on-year, and the load factor was 78.3% (-3.6 ppt compared to September 2025). Traffic on the Middle East–Asia corridor fell by 8.8%, a deeper contraction than the 7.9% decline recorded in August. By contrast, the 3.0% fall on the Middle East–North America corridor was a slightly smaller decline than last month.
Latin American airlines achieved an 8.2% year-on-year increase in demand. Capacity climbed 7.6% year-on-year. The load factor was 83.9% (+0.5 ppt compared to September 2025).
African airlines saw demand rise 8.0% year-on-year. Capacity was up 8.8% year-on-year. The load factor was 74.8% (-0.6 ppt compared to September 2025).
(Source: IATA)