
SINGAPORE, 5 September 2019: Five destinations in Asia – Bangkok, Singapore, Kuala Lumpur, Tokyo and Seoul – attracted 22% of tourist arrivals and 25.2% of the region’s travel expenditure, according to highlights from the Mastercard’s latest edition of the Asia Pacific Destinations Index 2019.
The index ranks 161 Asia Pacific destinations according to the number of overnight international visitor arrivals that they receive as well as their cross-border tourist spending.
A large part of the top cities of volume enjoyed by the top cities was attributed to the 62.4 million mainland Chinese travellers who made overnight trips to the region.
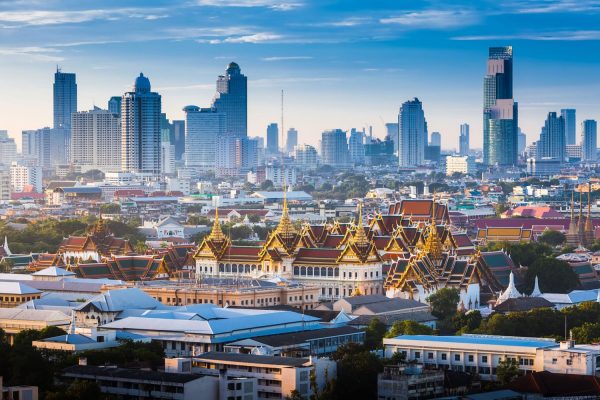
Bangkok and Singapore continue to hold on first and second spots in the index for the ninth year in a row.
Japan is the region’s most visited market, with five cities in the top 20 and seven of the 10 fastest-growing destinations in Asia-Pacific.
Japan’s tropical paradise, Okinawa, is Asia Pacific’s fastest-growing destination, having risen 109 places in the rankings since 2009.
Ludhiana in India’s northern state of Punjab is the second-fastest rising destination, having risen 78 spots in the past decade.
Top source markets for outbound travellers continue as usually topped by mainland China (18.2%), South Korea (9.1%) and Japan (6%)
In 2018, Asia Pacific hosted travellers making 342.2 million business and leisure trips, up from 159.1 million in 2009, representing an 8.9% compound annual growth rate (CAGR) over the nine-year period. During the same period, travel spending in Asia-Pacific more than doubled, rising from USD117.6 billion to USD281.1 billion, equating to a compound annual growth rate of 10.2%.
“While the worlds economic, geopolitical, technological and societal landscapes have all changed since Mastercard launched this research 10 years ago, one thing has remained constant; the desire of ever-growing numbers of people to explore the world beyond their own borders. With the top 20 cities attracting nearly half (49.8%) of all international overnight arrivals to the 161 destinations ranked in the APDI, it is important to understand not only how continuously rising travel numbers impact cities and destinations for the better, but also the challenges they pose. This equips governments, merchants and the global travel industry with the information and insights they need to serve their residents and visitors better,” said, Mastercard senior vice president, data & services, Asia Pacific, Rupert Naylor.
Top 20 Asia Pacific Destinations (2018)
|
Rank |
Destination |
Overnight int’l arrivals (million) |
Avg stay |
Avg spend per day (USD) |
Rank |
Destination |
Overnight int’l arrivals (million) |
Avg stay |
Avg spend per day (USD) |
|
1 |
Bangkok |
22.8 |
4.8 |
$184 |
11 |
Hokkaido |
6.3 |
5.1 |
$198 |
|
2 |
Singapore |
14.7 |
4.2 |
$272 |
12 |
Shanghai |
6.1 |
3.3 |
$285 |
|
3 |
Kuala Lumpur |
13.8 |
5.7 |
$142 |
13 |
Mumbai |
5.3 |
9.5 |
$106 |
|
4 |
Tokyo |
12.9 |
5.4 |
$196 |
14 |
Chennai |
5.1 |
8.7 |
$117 |
|
5 |
Seoul |
11.3 |
5.3 |
$155 |
15 |
Hanoi |
4.8 |
3.8 |
$78 |
|
6 |
Osaka |
10.1 |
3.0 |
$223 |
16 |
Taipei |
4.8 |
6.6 |
$176 |
|
7 |
Phuket |
9.9 |
4.9 |
$247 |
17 |
Sydney |
4.4 |
22.0 |
$83 |
|
8 |
Pattaya |
9.4 |
4.1 |
$164 |
18 |
Ho Chi Minh |
4.1 |
5.3 |
$98 |
|
9 |
Bali |
8.3 |
8.6 |
$125 |
19 |
Chiba |
4.0 |
1.0 |
$228 |
|
10 |
Hong Kong SAR |
8.2 |
3.4 |
$218 |
20 |
Okinawa |
3.9 |
4.3 |
$185 |
(Source: Mastercard)


